Example of Applying the"POWER OF THE PATTERN" to Wal-Mart (WMT)
Hi
I am honored by your continued interest in my research.
Below is an example of applying the Power of the Pattern to an asset that I monitor and suggested Premium subscribers take action to buy back in February
Note: The specific asset is not important as is the pattern analysis, which is the same, regardless of the asset
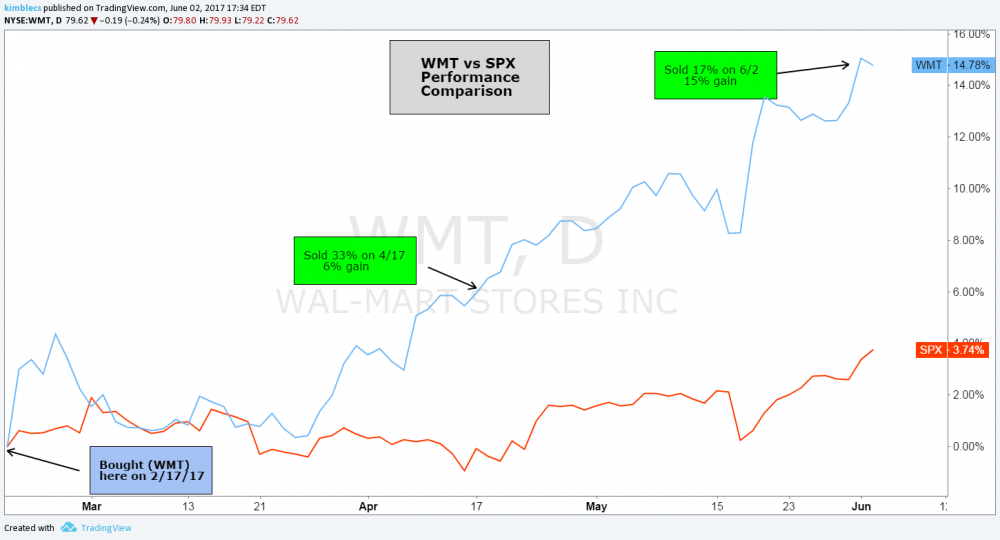
Power of the Pattern applied below to Wal-mart (WMT)
We suggested purchasing WMT on a breakout of a weekly bullish flag pattern over several months. Initial breakout was followed by a large gap-up which sold off, followed by a strong reversal to the upside; then off to the races to resistance around $80 where we took additional profits.
Along with Indices, sectors, commodities, the metals and a few individual stocks, these are the types of patterns and opportunities I continually work to find for our members
We suggested a purchase of WMT on February 17, 2017 as it broke out to the upside
Harvested recently at 2 (1st chart below)
Click Image Above to Enlarge
Below is a summary of gains compared to the S&P 500 since purchasing WMT
Click Image Above to Enlarge
If these are the types of patterns and opportunities you would like to stay current with, subscribe to our Premium or Weekly Combo Research
If you feel a test drive of my research would be of value to you, send me a reply and I'll forward you information to get started with a 30 day trial to my research
I hope you found this helpful. Please reply with any questions or if you would like additional examples